
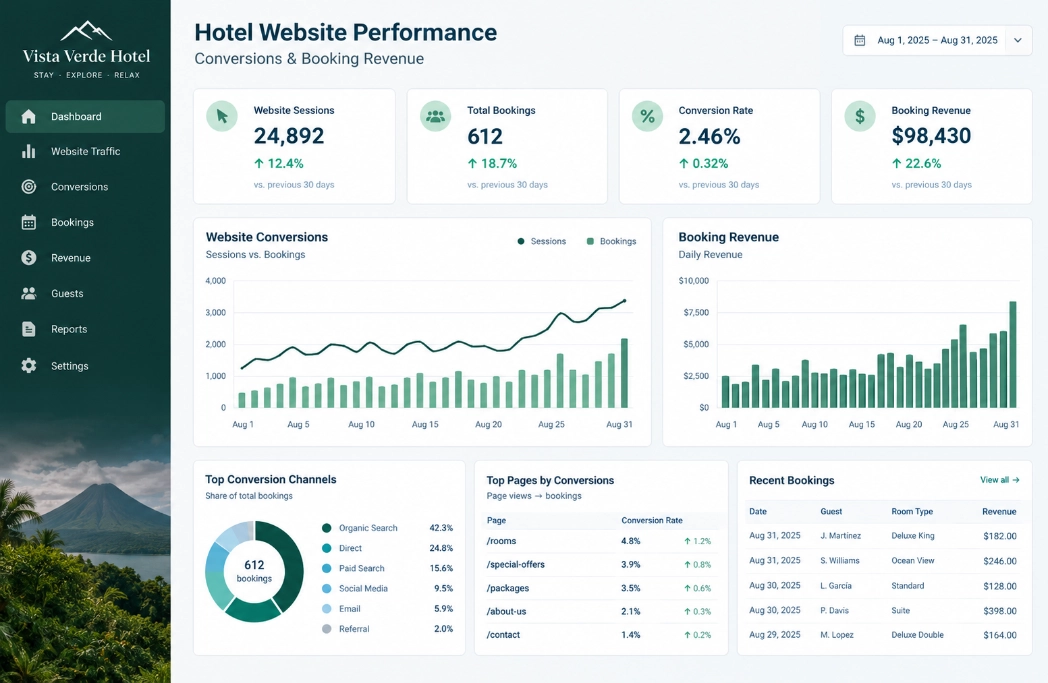
More data doesn’t always lead to better hotel marketing decisions. Your team may collect numbers from the website, booking engine, search platforms, social media, and paid campaigns, yet still struggle to see what’s actually contributing to reservations and revenue.
A useful hotel marketing dashboard should combine a focused set of business outcomes with channel-specific data that shows how travelers discover your hotel, move toward booking, and generate value.
In this guide, you’ll learn which metrics are important, how to organize them, and how to interpret the results so you can make clearer marketing decisions.
Why Hotels Need More Than Traffic and Engagement Metrics
Choosing the right metrics starts with understanding what each number can—and can’t—tell you. Awareness metrics, like traffic, impressions, clicks, and social engagement, show whether travelers are seeing and interacting with your marketing, but they don’t reveal its full business impact.
To understand whether that attention is creating value, connect channel activity with:
- Booking intent
- Completed reservations
- Direct booking revenue
- Acquisition costs
- Booking quality
- Profitability
By doing so, you can see how they contribute to the wider journey from discovery to reservation. And also, you understand how they support your hotel’s marketing efforts and revenue goals.
Start With an Overall Hotel Marketing Summary
Once you’ve connected marketing activity with business outcomes, the next step in your digital marketing strategy is to place the most important results at the top of your dashboard. This gives your marketing team and hotel management a quick performance summary before reviewing individual channels.
Include:
- Total direct bookings: Shows how many reservations came through your hotel’s own channels.
- Direct booking revenue: Reveals how much revenue those reservations generated.
- Website conversion rate: Measures the percentage of website visitors who completed a booking.
- Marketing cost per booking: Shows the average marketing spend required to generate each reservation.
- Customer acquisition cost: Measures how much you spend to acquire each new guest, including relevant marketing and sales costs.
- Return on ad spend: Compares the booking revenue attributed to advertising with the amount spent on ads.
- Direct versus OTA booking share: Shows how your reservations are divided between owned and third-party channels.
Review these metrics together. Revenue isn’t the same as profitability, and a strong ROAS doesn’t account for every operating, marketing, or cancellation-related cost.
Website and Booking Engine Metrics

After reviewing overall business outcomes, look more closely at how travelers move through your website and booking engine. These metrics connect marketing activity with direct reservations, showing whether visitors find the right information, check availability, and complete their bookings.
Website Traffic by Source
Website traffic by source shows how many visitors arrive through organic search, paid media, social media, email, referrals, and direct traffic. Rather than focusing only on which source sends the most visitors, compare how those users behave.
Look at whether they explore room pages, check availability, enter the booking engine, and complete a reservation. A smaller source that consistently generates booking activity may be more valuable than one that delivers high traffic with little intent.
High-Intent Page Performance
Track visits and engagement on pages closely connected to a booking decision, including rooms, packages, special offers, location information, and booking pages. Review which channels bring visitors to these pages and what they do next.
If traffic is growing but few visitors reach high-intent pages, your navigation, internal links, or campaign landing pages may need improvement. If people reach them but don’t check availability, the content, offer, or next step may not be clear enough.
Booking Engine Entry Rate
This metric shows how many website visitors take the next step and check your rooms, rates, or availability.
Booking engine entry rate = booking engine entries ÷ website visits × 100
For example, if 1,000 people visit your website and 200 check availability, your entry rate is 20%. A higher rate usually means more visitors are seriously considering a stay. Compare it by traffic source and landing page to see what brings you the most interested travelers.
Booking Engine Conversion and Abandonment
The conversion rate shows how many people book after entering the booking engine. The abandonment rate shows how many leave without finishing.
If many travelers start but don’t complete the process, check for problems such as:
- Slow loading
- Unexpected fees
- Limited payment options
- Confusing policies
- Too many booking steps
Compare mobile and desktop results to find where the booking process may be losing guests.
Direct Booking Revenue
Direct booking revenue is the money generated by reservations made through your hotel’s website. Review the revenue generated with the number of bookings, their average value, cancellations, and marketing costs to understand what those reservations are truly worth. When possible, identify which marketing channels and campaigns influenced that revenue to identify which sources produce valuable bookings, not just website visits.
Want fewer commissions eating into that revenue? Check out our guide: How Can Hotels Reduce OTA Dependency With SEO?
SEO Metrics for Hotels

Website performance shows what visitors do after arriving. SEO (search engine optimization) metrics help you understand whether organic search is bringing the right travelers there in the first place—and whether that visibility contributes to direct demand.
Turn search visibility into bookings. Read our post: How Can Eco-Lodges and Boutique Hotels Compete Online?
Organic Search Visibility
Organic search visibility shows how often your hotel appears in search results and whether travelers click through to your website. Track impressions, clicks, click-through rate, and average search position for terms related to your property, rooms, location, amenities, and experiences.
Review this information alongside your website analytics to see whether stronger online visibility brings relevant visitors to your priority pages.
Separate branded and non-branded searches because they reflect different opportunities:
| Search type | Example | What it reveals |
| Branded | “Harbor View Hotel Lisbon” | Interest from travelers who already know your hotel |
| Non-branded | “Boutique hotels near Belém Tower” | Visibility among travelers still comparing hotels |
More branded searches can indicate growing awareness. Non-branded searches show whether SEO helps new travelers discover your property.
Organic Traffic to Priority Pages
Measure organic visits to the pages most likely to support a booking, such as:
- Room and suite pages
- Packages and special offers
- Location and transportation pages
- Dining, spa, and amenity pages
- Wedding and event pages
- Relevant destination guides
Don’t evaluate organic growth by total traffic alone. An article may attract thousands of visits but contribute little to bookings if the topic has no clear connection to your hotel. Traffic to commercially relevant pages—or content that leads visitors to those pages—is usually more valuable.
Organic Conversions and Revenue
To understand whether SEO moves travelers closer to booking, follow their actions beyond the initial visit:
- Availability searches
- Booking-engine entries
- Completed reservations
- Direct booking revenue
- Assisted conversions
Review these outcomes by landing page and search type whenever your tracking allows. This helps you identify which pages attract qualified travelers, which ones support the booking journey, and where organic visitors leave before reserving.
Paid Advertising Metrics for Hotels
Like SEO, paid advertising should be measured by what happens after travelers reach your website. Impressions and clicks show campaign activity, but reservations and revenue reveal whether that activity creates value.
So how do you tell the difference? Our guide walks you through it: What Digital Marketing Strategies Work Best for Luxury Hotels?
Click-Through Rate and Cost per Click
Click-through rate (CTR) measures how often people click your ad after seeing it, while cost per click (CPC) shows how much you pay for each visit.
- CTR = clicks ÷ impressions × 100
- CPC = advertising spend ÷ clicks
Use these metrics to assess your ads, targeting, and competition. However, a high CTR or low CPC doesn’t guarantee valuable bookings.
Campaign Conversion Rate
Campaign conversion rate measures the percentage of ad-driven visitors who complete a defined action.
Conversion rate = conversions ÷ ad-driven visits × 100
Separate actions such as availability searches, inquiries, and confirmed reservations. Otherwise, minor interactions can make a campaign appear more successful than it is.
Cost per Booking
Cost per booking shows how much advertising spend is required to generate each confirmed reservation.
Cost per booking = advertising spend ÷ confirmed bookings
Compare it across campaigns, audiences, source markets, and room offers. A higher cost may still be worthwhile when it produces longer stays or higher-value reservations.
Booking Revenue and Return on Ad Spend
Booking revenue shows the value attributed to each campaign, while return on ad spend (ROAS) compares that revenue with advertising costs.
ROAS = attributed booking revenue ÷ advertising spend
Don’t rely on platform figures alone. Attribution settings, cancellations, and changing booking values can distort performance, so compare campaign reports with your booking records and review net revenue whenever possible.
Social Media Metrics for Hotels

Unlike paid search, social media often reaches travelers before they’re ready to book. It can build inspiration, awareness, and consideration, which makes it valuable across the hotel industry. Your reporting should still show whether that attention encourages travelers to learn more about your property.
Reach and Engagement
Reach, impressions, video views, saves, shares, comments, and engagement rate are useful key performance indicators for understanding how travelers respond to your content.
Compare results by content type instead of combining every interaction into one total. For example, room tours may generate website clicks, while local guides receive more saves and shares. This context shows which content supports each stage of the booking journey.
Website Traffic From Social Media
Measure how many visitors reach your website through organic posts and paid social campaigns. Then review:
- Which pages they visit
- How long they stay
- Whether they explore rooms or offers
- How often they check availability
- Whether paid and organic visitors behave differently
This helps you determine whether social content attracts casual viewers or potential guests.
Inquiries, Assisted Conversions, and Bookings
Inquiries, booking-engine visits, assisted conversions, and reservations are key metrics for evaluating whether social media contributes to more direct bookings.
Use tracking links and analytics data to connect campaigns with these actions whenever possible. However, don’t expect every organic interaction to produce a measurable reservation. Social media may introduce your hotel early in the journey, while another channel receives credit for the final booking.
Email Marketing Metrics for Hotels
Email helps you reconnect with past guests, nurture travelers who have shown interest, promote relevant offers, and encourage repeat stays. Measuring its results alongside your other digital marketing efforts shows whether those conversations lead to meaningful action.
Delivery, Open, and Click-Through Rates
Delivery rate shows whether your messages reach recipients, while open and click-through rates indicate how people respond. Together, they can provide actionable insights into list quality, subject lines, content, and calls to action.
Keep in mind that privacy features can make open rates less reliable. Review them alongside clicks, website activity, and conversions for a clearer picture.
Unsubscribe Rate
Unsubscribe rate measures the percentage of recipients who leave your list after receiving an email. A consistent increase across email marketing campaigns may indicate that messages are too frequent, poorly targeted, or not relevant enough.
Compare this rate by audience segment and campaign type to identify where adjustments are needed.
Email Conversions and Booking Revenue
Track how many recipients visit your website, check availability, complete a reservation, and generate revenue. Compare results by audience, offer, and campaign purpose to see which emails influence the booking journey.
Also review email’s contribution to total revenue and your direct booking percentage. These results can reveal whether email is simply generating clicks or helping you build a more valuable direct relationship with guests.
Booking Quality and Revenue Metrics
Two channels can generate the same number of reservations without delivering the same business value. In the hospitality industry, these hotel performance metrics help you identify the guests and channels that maximize revenue:
- Average booking value: Shows how much revenue each reservation generates and whether your target audience books higher-value stays.
- Average length of stay: Reveals which channels attract guests who stay longer.
- Cancellation rate: Identifies booking sources that lose value before guests arrive.
- Net booking revenue: Shows what reservations are actually worth after cancellations, refunds, and adjustments.
- Revenue by source market: Highlights the countries or regions generating your strongest returns.
- Revenue by channel: Compares OTAs with your direct booking channel and other direct channels.
- Repeat booking rate: Shows which channels attract guests who return and provide longer-term value.
You can compare these results with revenue per available room for a broader view of how valuable bookings contribute to overall hotel performance.
Want to know which countries are worth marketing to? Find out in our blog: How Can Hotels Market to International Guests Online?
How to Build a Useful Hotel Marketing Dashboard

A useful monthly dashboard gives your team a clear view of performance without overwhelming them with data. Build yours using this simple process:
- Define your current marketing goals. Decide whether you want to increase direct bookings, reach a new market, reduce acquisition costs, or improve another specific result.
- Choose metrics for each goal. Include only the numbers that help you measure progress and make decisions.
- Organize metrics by channel. Separate website, SEO, paid advertising, social media, and email results so you can evaluate each area clearly.
- Place business outcomes at the top. Lead with overall bookings, marketing costs, and revenue before showing channel-level details.
- Add meaningful comparisons. Compare results with previous months, the same period last year, and relevant hotel targets.
- Explain important changes. Add short notes about unusual increases, declines, seasonal shifts, or campaign adjustments.
- Define the next actions. Finish with what your team should continue, improve, test, or stop during the next reporting period.
Your dashboard should support decisions, not simply record activity. If a metric doesn’t help your team understand performance or choose what to do next, it probably doesn’t need to be included.
How Often Should Hotels Review Their Marketing Metrics?
Not every metric needs daily attention. A consistent review schedule helps your team catch urgent problems without reacting too quickly to normal fluctuations.
- Weekly: Check campaign spending, tracking errors, booking-engine problems, and sudden performance changes that may require immediate action.
- Monthly: Review channel performance, conversion rates, cost per booking, revenue, and overall dashboard results.
- Quarterly: Reassess budget allocation, source-market performance, content strategy, and channel priorities.
- Seasonally: Analyze demand patterns, booking windows, source markets, promotions, and year-over-year performance.
Always consider your hotel’s seasonality and typical booking windows before evaluating short-term results. A campaign targeting guests who book several months ahead may need more time to generate reservations, while a temporary decline could simply reflect lower seasonal demand.
A dip isn’t always a problem. Sometimes it’s just the season. Learn more: Why Hotel Digital Marketing Performance Changes With the Seasons
Common Hotel Marketing Reporting Mistakes
A dashboard can contain plenty of data and still provide little direction. Avoid these common reporting mistakes:
- Including too many metrics: Extra data can distract your team from the results that matter most.
- Reporting traffic without conversions: Website visits don’t show whether travelers check availability or book.
- Treating all conversions as bookings: A page view, button click, inquiry, and confirmed reservation represent different levels of intent.
- Combining organic and paid data: Separating these channels helps you understand their individual costs and contributions.
- Ignoring mobile performance: Mobile booking problems may remain hidden when results are reviewed only as a total.
- Evaluating campaigns too early: Allow enough time for the typical booking window to pass before judging results.
- Reporting gross revenue alone: Cancellations and refunds can significantly reduce the real value of a campaign.
- Relying on one attribution source: Advertising platforms, analytics tools, and booking systems may credit conversions differently.
- Presenting results without next steps: Every report should explain what your team should continue, change, investigate, or stop.
The goal isn’t to create the most detailed dashboard. It’s to provide enough reliable information to support your next marketing decision.
Turn Hotel Marketing Data Into Better Decisions With Nativo
Tracking more data won’t automatically improve your marketing. You need a focused dashboard that connects each channel with booking behavior, acquisition costs, and revenue—and makes your next steps clear.
At Nativo, we help hotels organize their marketing data, identify performance gaps, and turn insights into practical improvements. Contact Nativo today to build a measurement strategy that supports stronger campaigns and more valuable direct bookings.
FAQs
How can hotels track direct bookings from marketing campaigns?
Hotels can use analytics tools, campaign tracking links, booking-engine data, and conversion tracking to connect reservations with specific channels. Compare this information with confirmed booking records to account for cancellations and attribution differences.
What is a good hotel website conversion rate?
There is no universal conversion rate for every hotel. A useful benchmark should reflect your property type, market, season, traffic sources, booking window, and device mix. Compare performance with your own historical results and identify opportunities for steady improvement.
How often should hotels review their marketing metrics?
Hotels should check urgent issues weekly, evaluate channel and revenue performance monthly, review budgets quarterly, and analyze demand patterns seasonally. Allow for typical booking windows before judging campaign results.
What is the difference between cost per booking and customer acquisition cost?
Cost per booking measures how much marketing spend generates each reservation. Customer acquisition cost measures the broader cost of acquiring a new guest and may include additional marketing and sales expenses.
Should hotels track marketing revenue or return on ad spend?
Hotels should track both. Marketing revenue shows how much campaigns generate, while return on ad spend compares attributed revenue with advertising costs. Neither fully measures profitability, so review them alongside cancellations, acquisition costs, and net revenue.